
Dashboard and user experience information
Below you will find answers to questions about the dashboards and user experience. Can’t find the answer to your question? Please contact us directly so we can assist you as quickly as possible.
When you start using Focus Feedback, you get access to your own dashboard. The dashboard displays numbers, trends and feedback. Every organization starts with a basic dashboard and can customize it with their own widgets. This way, you always have the latest data available for daily follow-up and management meetings.
Closed Loop Feedback means you act on the feedback you receive and report back.
At Focus Feedback, it works like this:
– Customers share their opinions via the survey;
– You receive the feedback in a clear dashboard;
– You assign feedback to colleagues, adding notes and a status: ‘to do’, ‘in progress’ or ‘done’.
This way, you can focus on improvement points and show internally that action is being taken. By reporting back to your team and your customers, you close the feedback loop. It’s not just about measuring, but also about acting.
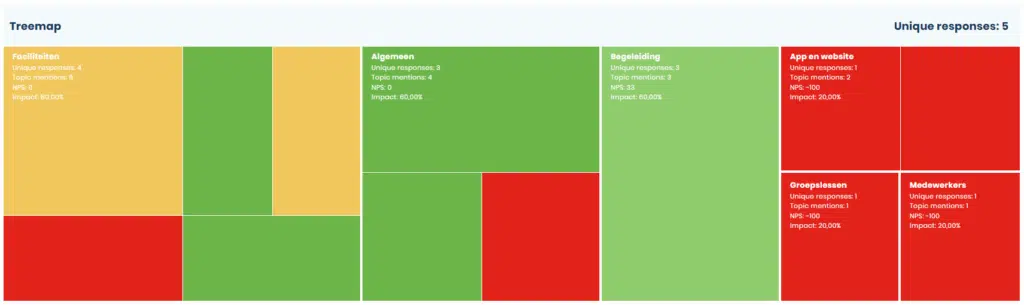
The Verbatim Analysis dashboard shows at a glance what customers are saying and what topics they are discussing.
Albert AI automatically groups all open-ended responses by theme. You can immediately see which topics come up most often, the overall sentiment and what is important within your organization. The more frequently a topic is mentioned, the larger its box appears. The color of the box indicates the sentiment, with dark green representing very positive feedback and red representing negative feedback.
No more scattered quotes, just clear overview and insights, ready to share internally.
.
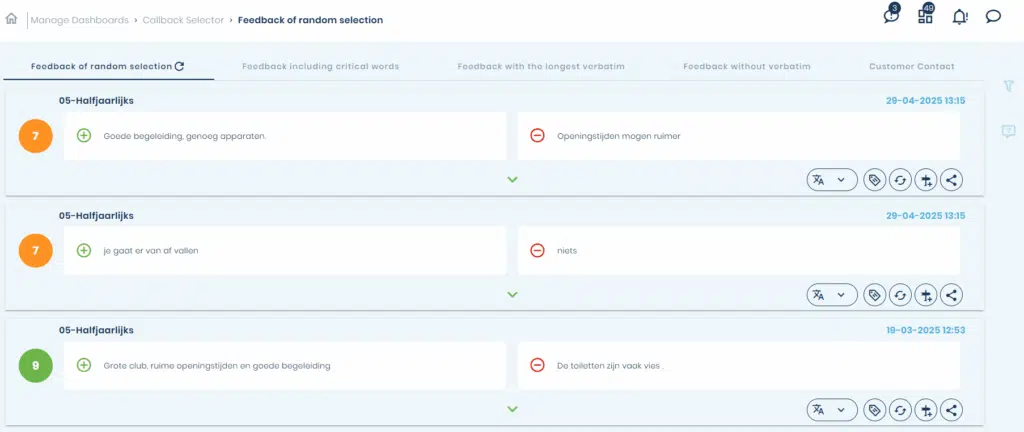
In the Callback Selector dashboard, you can see feedback that requires urgent follow-up.
You get access to a basic dashboard that contains the most important information. The dashboard displays various charts, such as a chart with the Net Promoter Score (NPS), NPS segments and your NPS trend. We also show the NPS per measurement moment and provide insight into strengths and areas for improvement.
Create a new dashboard by selecting Dashboards in the left menu and then ‘Create a Dashboard’. You can also choose ‘Create a Dashboard’ from the Home screen.
- Enter a name for your dashboard.
- Select Add Widget.
- Choose the widgets you want to add.
- Use the filter to select the data you want to see.
- If needed, select the type of chart.
You can find your feedback in several places:
1. Speech bubble at the top right: here you can see the most recently received feedback. You can also easily filter this overview.
2. Responses: here you will find a complete list of all feedback and the corresponding NPS scores.
3. Dashboard: in your personal dashboard, you will find the feedback widget.
4. Closed Loop Feedback Bucket: here you can assign feedback directly to the callboard. A handy tool to follow up on all feedback together with your colleagues.
In the Inspiration Center, you can find articles, book recommendations, videos and guides. Additionally, the release notes keep you informed about the latest updates within the application. The Inspiration Center is also very useful for consulting manuals and tutorial videos when you want to learn more about what’s possible within the application. Only customers with access to Focus Feedback can access the Inspiration Center.
The emails can be styled in your own branding. This builds more trust and increases the chances that your customers will open and complete the survey. The email is also personalized with the customer’s first name.


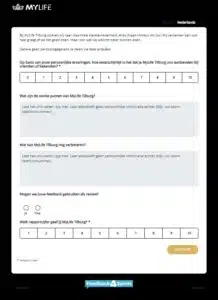
We send the surveys entirely in your own branding. This ensures recognition for your customers and leads to a higher response rate.
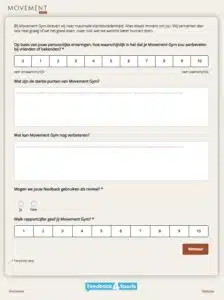
We send a short survey with the following questions:
Would you recommend our organization to friends or acquaintances?
What is going well?
And what could be improved?